Changes made to campus life, COVID-19 data portal
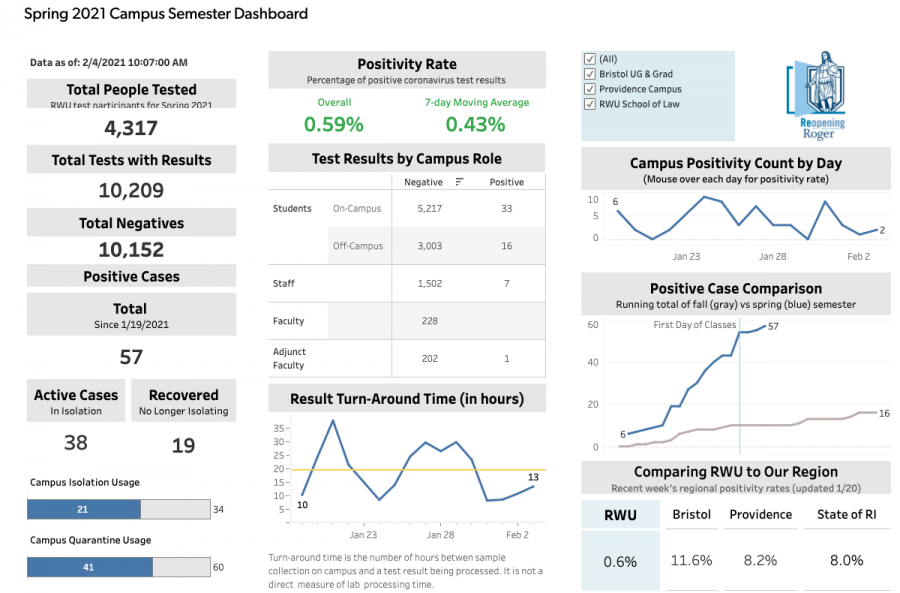
Courtesy of RWU COVID-19 Data Hub
RWU’s COVID-19 Data Hub now has university data in comparison to regional data and will have other updated features coming this month.
The spring semester has started and with the pandemic still ongoing, the university is making changes to ensure the safety of faculty and students. New guidelines have also been established for students that will be revisited in a couple of weeks.
These new guidelines include a ban on inter-residence hall visitations. Students living on campus are only allowed to visit with other students from the same residence hall. This will be reconsidered on Feb. 10. Student positivity rates, quarantine and isolation numbers and testing compliance will determine if inter-residence hall visitation will be allowed again.
“I do think we can return to inter-residence hall visitation and Residence Life and Student Life understand how important that is for students within our residential communities. In essence — when we do is dependent on student decisions these next few weeks,” said John King, Vice President of Student Life.
King advised students to practice mask wearing, social distancing and not to attend off campus gatherings.
The data portal on the Reopening Roger site will be revamped later this month. Changes like a mobile-friendly version of the dashboard, campus vaccination data, and tracking positive cases from non-campus testing are among the changes.
A chart with the business of testing times was removed from the dashboard to make room for four new sections.
“We removed this because the community generally has their one or two set times to test each week. Seeing that it is quieter at 8 a.m. on Thursdays was not something that needed to take up that much “real estate” on the dashboard,” said Chief of Staff Brian Williams.
These new sections include the number of active and recovered cases, quarantine and isolation numbers, positive cases now compared to the fall semester and positive cases at RWU compared to regional data.
Williams said the decision to add a chart comparing cases to the region serves as a reminder of what is happening on campus and in the state.
“To me, this section is a daily reminder that things are good on campus but we are not in a bubble,” Williams said.
The dashboard has already been a popular spot online with over 114,000 views as of Jan. 29.
“The dashboard is a measurement of our community commitment to each other. The newer data hopefully lets everyone continue to see that we are all in this together and that each of our actions, showing up for testing times, complying with our safety measures, is working; and that the choices we make have an effect on the whole institution and RWU family,” Williams said.
King said the university is more prepared for this semester in many ways.
“The Reopening Roger Steering Committee and the Emergency Response Team have continued to meet regularly. In November, the university hired an Infection Prevention consultant who has spent considerable time assessing and improving all our student-facing service staff team’s approach to prevention. We now have a full-time COVID Prevention Coordinator, Kathleen Yorks,” King said.
King predicts the semester will start with more positive cases than last semester but toward the end, that there will be fewer cases than there were at the end of the last semester.
Rachel Dvareckas was a 2022 RWU journalism graduate who spent four years dedicated to The Hawks’ Herald. She currently takes on more creative roles...